Investing
How to Track Your Investment Portfolio in a Spreadsheet (Free Template Walkthrough)
August 20, 2026
August 20, 2026
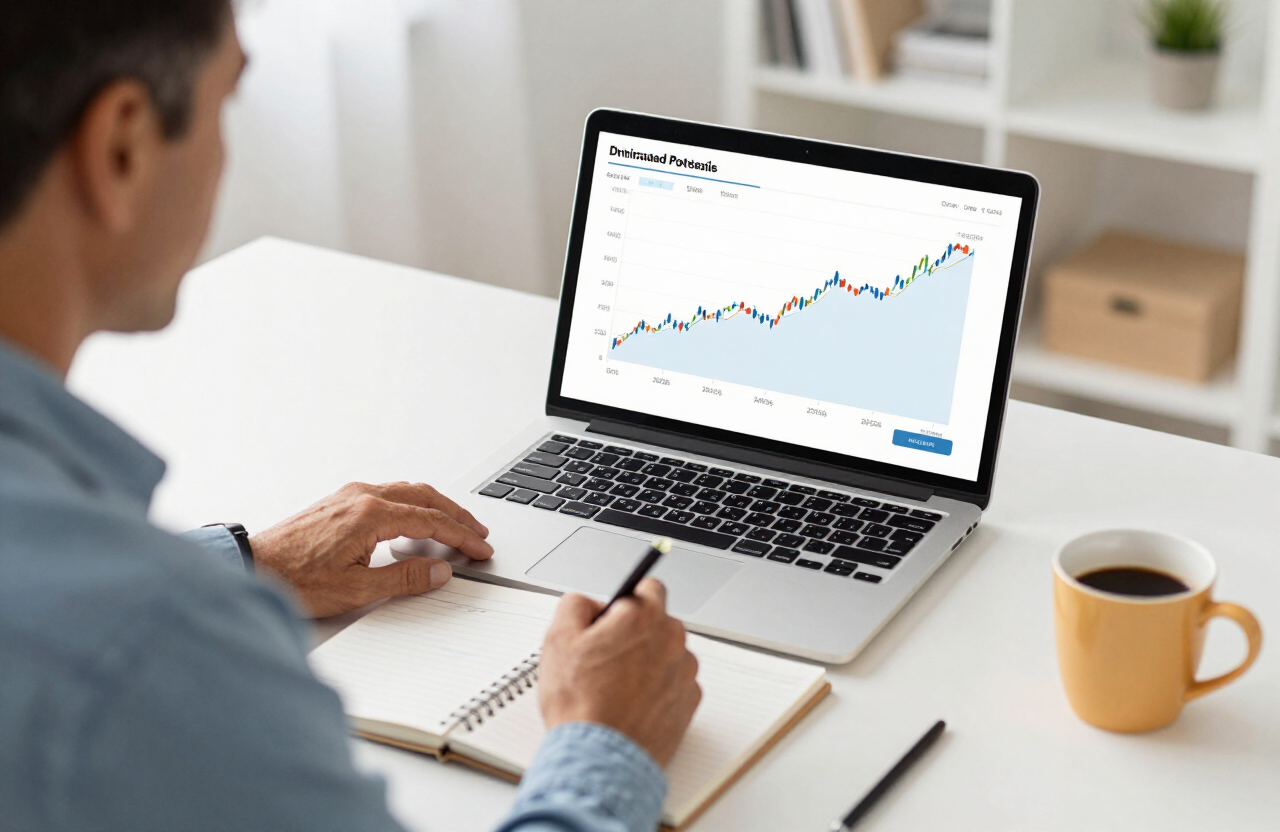
If you've ever tried to answer a simple question like 'what's my actual asset allocation across all my accounts?' and ended up with three browser tabs, two PDF statements, and a headache, you already understand why investment portfolio tracking matters. Most investors don't have one account—they have a 401(k) from a current job, an old IRA rolled over from a previous employer, a brokerage account for individual stocks, maybe a Roth IRA, and a high-yield savings account holding cash. Each one has its own login, its own statement, and its own partial view of your wealth. None of them shows the whole picture.
A portfolio tracker spreadsheet solves this by pulling every holding into one place so you can see your total balance, your true asset allocation, and your real performance—without paying for software or handing your credentials to a third-party aggregator. This walkthrough shows you exactly how to build and maintain a portfolio tracker spreadsheet, column by column, so investment management becomes a 15-minute monthly habit instead of a quarterly guessing game.
There's no shortage of portfolio monitoring apps that promise to sync every account and chart your net worth automatically. Some are excellent. But for many investors—especially those who value privacy, want full control over their data, or hold a mix of accounts that don't aggregate cleanly—a spreadsheet is still the most reliable tool. You enter the numbers yourself, which means you actually look at them. You decide how holdings are categorized, which means your asset allocation reflects your strategy rather than an algorithm's guess. And you can customize everything, from the benchmarks you compare against to the rebalancing thresholds that trigger a trade.
A spreadsheet also forces the one habit that makes investment management work: regular attention. When you manually update your portfolio tracker once a month, you notice drift, you notice fees, and you notice when a holding has grown to dominate your portfolio. Passive apps make it easy to set and forget, which is great for avoiding panic-selling but terrible for staying intentional. A spreadsheet keeps you engaged with your wealth building without demanding daily attention.
A functional investment tracker doesn't need to be complicated. At minimum, your spreadsheet should capture six pieces of information for every holding: the account it lives in (401(k), IRA, brokerage, cash), the holding name and ticker, the asset class (US stocks, international stocks, bonds, cash, real estate, alternatives), the number of shares, the current price, and the current market value. With those six columns, you can calculate everything else—total portfolio balance, allocation by asset class, allocation by account, and drift from your target mix.
Add a target allocation column next to your actual allocation so the spreadsheet can show the gap between where you are and where you want to be. This single comparison is the heart of portfolio monitoring: it tells you at a glance whether you need to rebalance and, because each holding shows its own drift, exactly which trades to make. A well-built portfolio tracker spreadsheet turns rebalancing from a vague anxiety into a concrete to-do list.
Start by inventorying every investment account you own—don't skip the small ones. A forgotten old 401(k) with $8,000 in it still affects your asset allocation, and consolidating or at least tracking it is part of responsible investment management. For each account, list every holding inside it. A target-date fund counts as one holding, but it's worth noting that it contains a mix of asset classes internally; some trackers break target-date funds into their underlying stock and bond components for a more accurate allocation view.
Log the current share count and price for each holding. Most brokerages display this on the positions page, and you can pull current prices from any finance site. Don't worry about cost basis or purchase date yet—those matter for tax planning, but they're not required to track allocation and performance. The goal of this first pass is a complete, accurate snapshot of what you own right now.
Asset allocation is the single most important decision in long-term investing, and you can't manage it if you can't see it. Assign every holding to one of a small set of asset classes: US stocks, international stocks, US bonds, international bonds, cash, real estate, and alternatives. Be consistent—an S&P 500 index fund is US stocks, a total bond market fund is US bonds, a money market fund is cash. If you hold a balanced or target-date fund, either categorize it by its dominant exposure or break it into components for precision.
Once every holding is categorized, sum the market values within each asset class and divide by your total portfolio value to get your actual allocation percentages. This is the number most investors have never accurately seen, because no single account statement shows it. Seeing your true asset allocation for the first time is often surprising—many investors discover they're far heavier in US stocks than they intended, or that cash they forgot about is dragging down their overall return.
Your target allocation should reflect your time horizon and risk tolerance, not a generic rule of thumb. A common starting point for someone 20 to 30 years from retirement is 80% stocks and 20% bonds, shifting gradually toward 60/40 or 50/50 as retirement approaches. Write your target percentage for each asset class in a column next to your actual percentage, and have the spreadsheet calculate the difference. That difference is your drift.
Set a rebalancing threshold—most investors use 5 percentage points of drift as the trigger to act. If your target is 70% stocks and you've drifted to 76%, that's a rebalancing signal. If you're at 72%, you can leave it alone. This rules-based approach keeps you from tinkering constantly while ensuring your portfolio never drifts so far that your risk exposure no longer matches your plan. Portfolio monitoring without a threshold leads to either paralysis or overtrading; a clear threshold leads to confident, occasional adjustments.
Performance tracking in a spreadsheet is intentionally simple, and that's a feature. Each month, record your total portfolio balance and your total contributions for the month. Over time, comparing your balance growth against your contributions tells you whether your portfolio is actually growing from investment returns or just from you adding money. This is the most honest view of investment performance most people ever see, because it strips away the misleading per-holding return percentages that brokerages love to display.
For deeper analysis, you can add a benchmark column comparing your overall return to a simple index like a 60/40 blended benchmark or the S&P 500. If your carefully selected portfolio is underperforming a basic index fund mix over multi-year periods, that's valuable information—it may be a sign that fees, individual stock picks, or overly complex holdings are dragging on your wealth building. The point isn't to chase benchmarks every quarter; it's to confirm over years that your investment strategy is working as intended.
The spreadsheet only helps if you use it consistently. Pick a monthly date—the first of the month, the day after a paycheck, or the same Sunday as your budget review—and spend 15 minutes updating prices, refreshing your allocation, and checking for drift beyond your threshold. Most months, you'll find nothing to do, which is exactly the point. A well-allocated portfolio doesn't need constant trading. The monthly check-in simply confirms that your plan is still on track and catches drift before it becomes a problem.
When drift does exceed your threshold, rebalance with new contributions first rather than selling holdings, which avoids triggering taxable gains in your brokerage account. Direct new money into the asset class that's below target until the drift closes. Only sell to rebalance when contributions can't close the gap or when you're rebalancing inside a tax-advantaged account where sales aren't taxable. This tax-aware rebalancing approach is one of the quiet advantages of hands-on investment management over set-and-forget robo-advisors.
The most common mistake is tracking too often. Checking your portfolio daily turns investing into an emotional roller coaster and encourages performance-chasing behavior that destroys long-term returns. Monthly is enough for portfolio monitoring; quarterly is fine for busy periods. A second mistake is ignoring accounts you consider 'small'—every holding affects your allocation, and small accounts often hold the most surprising drift. A third is overcomplicating the spreadsheet with dozens of asset subclasses; six to eight categories are enough to manage allocation without turning every update into a data-entry marathon.
Finally, don't confuse tracking with trading. The purpose of a portfolio tracker spreadsheet is awareness, not activity. Most months, the right action is to update the numbers, confirm you're within your thresholds, and close the spreadsheet. The discipline to do nothing when nothing needs doing is one of the most valuable skills in long-term investing—and a clear, honest tracker makes that discipline possible.
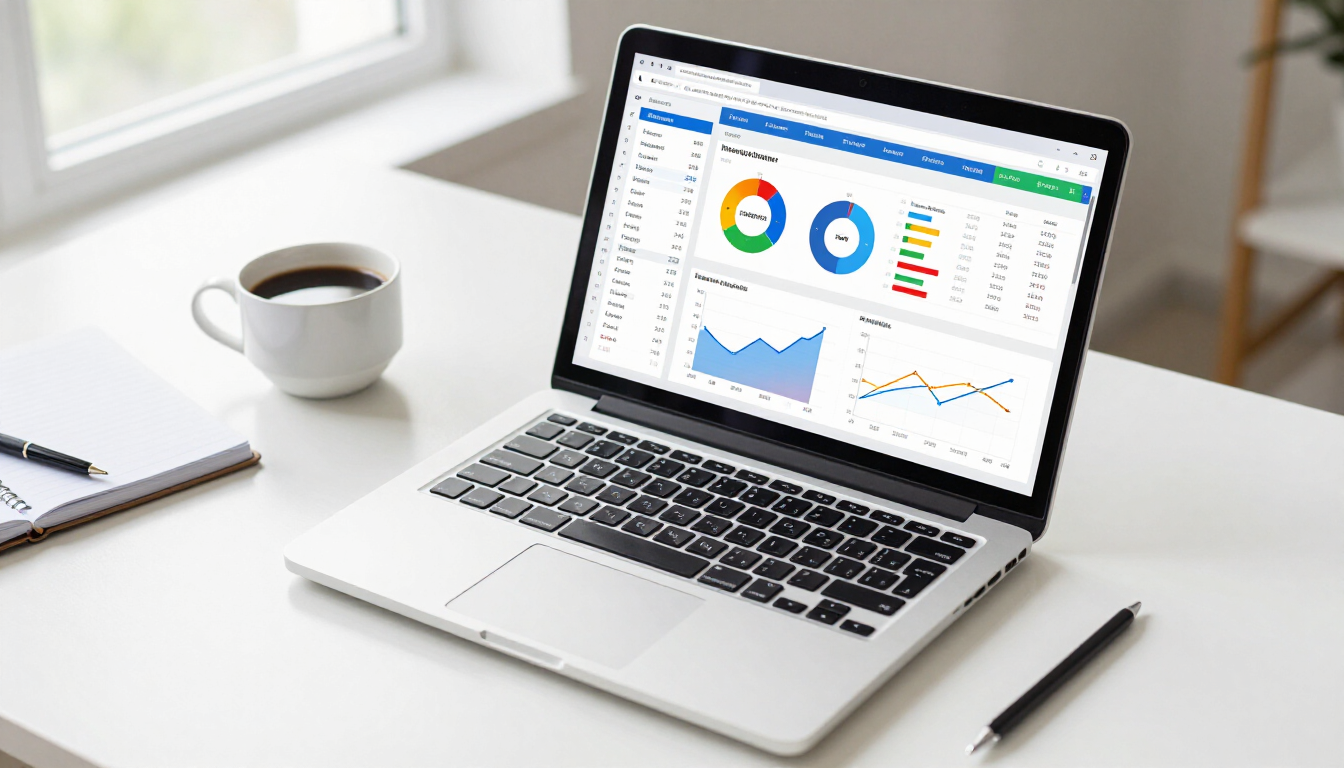
The Investment Portfolio Tracker: Excel Spreadsheet + Guide gives you a ready-made portfolio tracker spreadsheet so you can skip the setup and start monitoring your investments today. It comes pre-built with columns for every holding, automatic asset allocation calculations, target-vs-actual drift tracking, and a performance dashboard that shows your total balance, contributions, and growth over time. The included guide walks you through categorizing holdings, setting your target allocation, and building the monthly rebalancing habit that keeps your wealth building on track. Whether you're consolidating accounts for the first time or refining an existing investment management routine, the tracker turns scattered statements into one clear picture of your portfolio—so every investment decision you make starts from the truth of what you actually own.
Put this article into action with the exact tool built for the job. Instant download, yours forever.
Shop this tool